Current performance
Generated from run 2026-09-28_run_001 (2026-09-28), 160 cases,
baseline solver lmfit. Regenerated on every docs build from the latest benchmark
run — see Benchmark engine for how
this number is produced and what it gates.
This page is a teaser — the full report is one click away
Everything below is a summary. For the complete, self-contained
interactive benchmark report — every one of the
160 cases, every backend, every diagnostic plot from
this same run — open report.html. Linked page-relative (../report.html),
not root-absolute: GitLab Pages happens to serve this project from its own
unique domain root, but GitHub Pages serves it as a project page under
/SpectraFit-Core/, so a root-absolute /report.html 404s there even
though it isn't part of the docs source tree itself (see
tests/audit/test_audit_built_site_links.py's _CI_ASSEMBLED handling,
which resolves relative CI-assembled links against the page before
exempting them).
| Metric | Value |
|---|---|
| Gate | ✅ PASS |
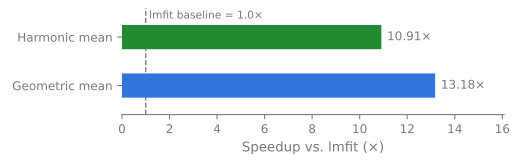
Geomean speedup vs. lmfit |
13.18× |
| spectrafit win rate | 84.4% |
Max \|Δr²\| vs. lmfit |
1.29e-04 |
| Regressions | 0 |
Reading the win rate: optfn pulls it down on quality, not speed
spectrafit win rate is a composite score (r²·speedup) blended across
every case category, including optfn — deliberately multimodal
global-optimization landscapes. On those cases spectrafit's "global"
solver is typically the fastest backend (its median per-case speedup
there tends to be the highest of any category), but it can converge to a
different — sometimes worse — local optimum than lmfit's
population-based differential-evolution search, so it loses on the
composite score more often than every other category despite winning on
raw wall-clock time. optfn is excluded from the accuracy (|Δr²|)
gate above for the same reason (see
Benchmark engine).
A single blended win-rate number can't show this split — see
report.html to filter by category and check yourself.
All backends, side by side
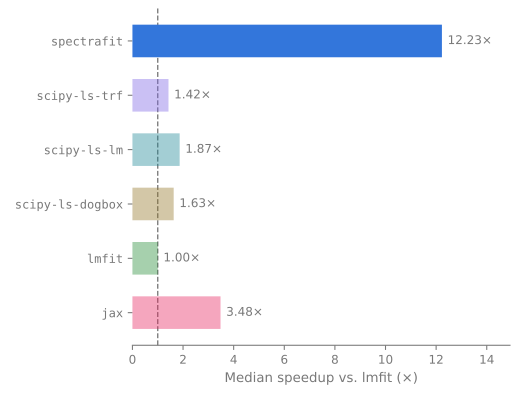
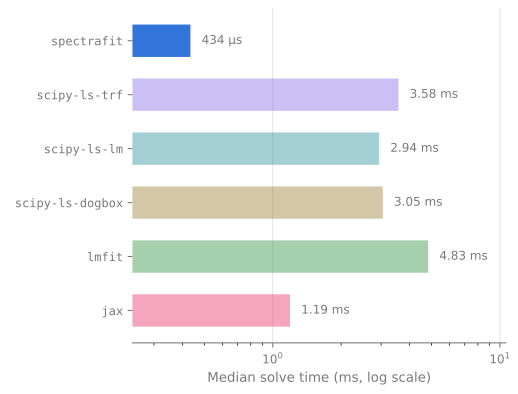
One row per backend, sorted alphabetically — order implies nothing. Speedup is relative
to the baseline (lmfit = 1.00×): a measured ratio, not a ranking. These are the
same medians the dashboard shows, computed by the same reduction.
| Backend | Median solve | Median r² | Speedup vs lmfit |
Cases run |
|---|---|---|---|---|
jax |
1.19 ms | 0.9991 | 3.48× | 136 |
lmfit |
4.83 ms | 0.9988 | 1.00× | 160 |
scipy-ls-dogbox |
3.05 ms | 0.9988 | 1.63× | 156 |
scipy-ls-lm |
2.94 ms | 0.9988 | 1.87× | 156 |
scipy-ls-trf |
3.58 ms | 0.9988 | 1.42× | 156 |
spectrafit |
434 µs | 0.9988 | 12.23× | 160 |
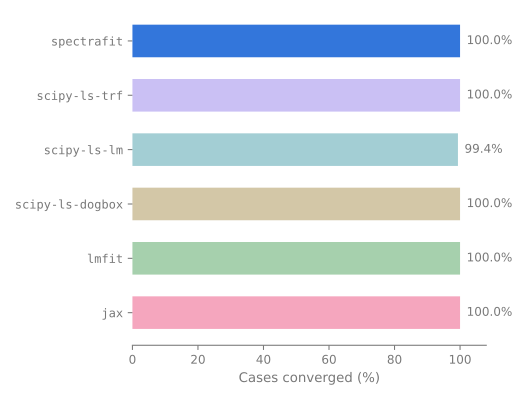
Speed vs. accuracy, case by case
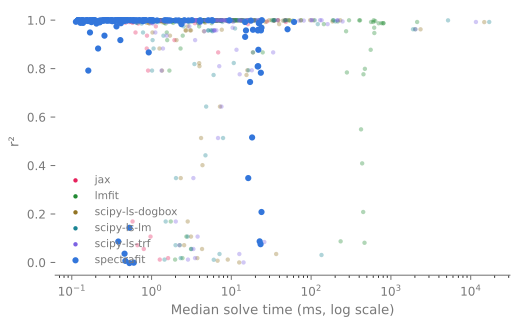
Every dot is one benchmark case for one backend — spectrafit-core drawn on top and at full colour, the other backends muted underneath, so the real per-case spread is visible without erasing the comparison.
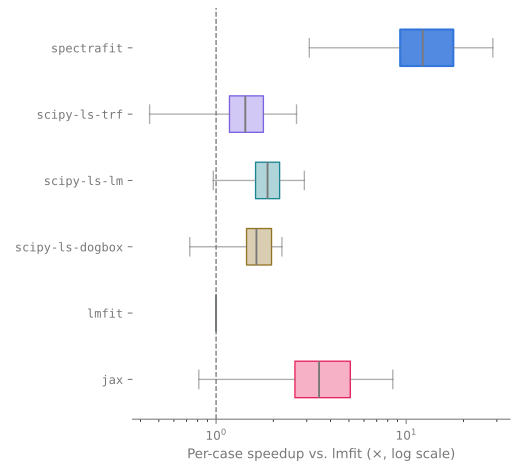
Speedup spread across cases
The median-speedup bar above is one number; this is the distribution behind it — how consistent each backend actually is from case to case.