
spur
Runs a pipeline once under a tracer and records, for each step, the functions it called, every file it read and wrote with its sha256, and whether it read exactly what the step before it wrote.
The name. Spur is a trace, and on the shop floor the Bearbeitungsspuren are the marks each operation leaves on a workpiece — which tool cut it, in which order — that an inspector reads to say how the part was made. A computed result has the same history: which step wrote it, from which files, through which functions. This plugin records it while the run happens, so a reviewer can read it back instead of reconstructing it.
- Use when someone asks how a result was produced — which functions ran, which files each step read and wrote — or whether one step's output really is the next step's input.
- Not when you want to know whether the tests would catch a bug — use
zeugnis— or want a handoff between stages proven and its gap fixed — useandon.
Use case
Situation. A paper's reviewer asks how out/report.txt was produced, and whether the summary step really read what the cleaning step wrote. In this run something else touched the intermediate file in between. Call. spur_trace.py run -- python3 run_pipeline.py --tamper, on the committed fixture pipeline in scripts/fixtures/pipeline/. Writes. analysis/spur/<runId>/trace.json, prov.json and spur-report.html, and nothing else. The traced code is never edited. Next. Open spur-report.html. The run exits 3 because one link is broken: find what ran in between (the record names it), fix the pipeline, and trace it again.
{
  "path": "work/records.csv",
  "sha256": "0fe98bb1d9ad159992bb9a1ce5c61e935233bb52d5ab1abdd4bd0b10138c5248",
  "producer": "s3",
  "version": 2,
  "status": "broken",
  "expected": "f20e8478c8b21dbf1f69b4bbbc9cb3bc5b37f0f9f458be6382b46b31b1ff349b",
  "note": "changed after s3 wrote it -- untraced step(s) ran in between: s4"
}
From scripts/fixtures/spur-demo.json, the second input of step s5 (summarize.py), copied unedited; s4 is the untraced sh -c step the --tamper flag inserts.
Why this exists
A reviewer's question — "how was this number produced?" — is not answered by coverage or by a test report. It needs an execution trace with retrospective provenance: per step, the call tree of the project's own code, every file read and written with its hash, and a check that each input is the bytes its producer wrote.
The session that proposed this plugin (#143) measured two existing tracers on a ten-step Python pipeline. noWorkflow 2.1.3 finished 4 of 10 steps: its AST rewriter crashed on ordinary Python 3.12 code, and it returned exit 0 after the failures. VizTracer 1.1.1 with an audit hook finished all 10 at about 1.2–1.4× overhead with outputs identical to an untraced run, but its HTML loads scripts from a CDN. spur takes the second route and keeps its lessons as rules: never rewrite the traced code, trace children through an environment variable, record no environment values and no file contents, redact home paths, and load nothing from the network.
What it is not
- Not
zeugnis. zeugnis asks whether code that looks verified is — whether the tests would catch a mutation, whether contracts match their call sites. spur does not judge the code; it records what one run did. - Not
andon. andon proves a handoff between stages and refuses to advance past one it cannot prove, fixing gaps in order. spur proves nothing about a contract: averifiedlink means the bytes match, not that the step was right. - Not
befund. befund maps a codebase's static structure. spur records one dynamic run; a function that did not run is not in its tree. - Not a profiler. Times are recorded, but the page is ordered for provenance — which step fed which — not for finding where time went.
Install
/plugin marketplace add Anselmoo/werkstoff
/plugin install spur@werkstoff
Or point Claude Code at the directory: claude --plugin-dir /path/to/werkstoff/plugins/spur. The scripts are stdlib only; tracing calls needs Python 3.12+ (sys.monitoring).
How a run is recorded
python3 scripts/spur_trace.py run -- <command> runs the command once. It prepends scripts/spur_boot/ to PYTHONPATH and sets SPUR_TRACE_DIR, so every Python process the command starts — itself and every child that inherits the environment — loads spur's sitecustomize, which records that process's own calls (sys.monitoring) and file I/O (sys.addaudithook). Each process is one step. A process that left no record — a shell, a cp, a Python started with -I — is kept as an untraced step, its command known and its I/O not. Any tracer fault is caught and counted in dropped, never raised into the traced program.
The acceptance test runs the fixture pipeline traced and untraced and compares every output by sha256: byte-identical, on Python 3.12, 3.13, 3.14 and 3.15.
The hash chain, and files rewritten in place
An input is hashed when its step first opens it for reading, before that step can rewrite it. An output is hashed when its step exits, and again before each child process it spawns. Every changed hash of a path is a new version path@n, numbered in commit order across the whole run, so a file rewritten in place becomes path@2, path@3, …
A consumer's input is checked against the latest version of that path committed before the consumer read it. In the fixture, normalize.py reads work/records.csv@1 (checked against ingest.py's write) and rewrites it as @2; summarize.py is then checked against @2, not @1. Each input ends in one of four states:
| state | meaning |
|---|---|
verified | the input's sha256 equals that latest version's |
broken | it differs: something outside the traced steps changed the file in between |
unverified | no traced producer, yet the file changed during the run, or it could not be hashed |
source | no producer, and the file predates the run |
unverified is never a pass. The run exits 0 only when every link verified; 3 when one is broken; 4 when the chain is incomplete or empty; and with the command's own exit code when the command failed. spur_trace.py verify <run dir> separately re-hashes the final outputs on disk — drift after a run is not a chain break. The full format, and how it maps to W3C PROV-JSON, is in references/trace-format.md.
The report page
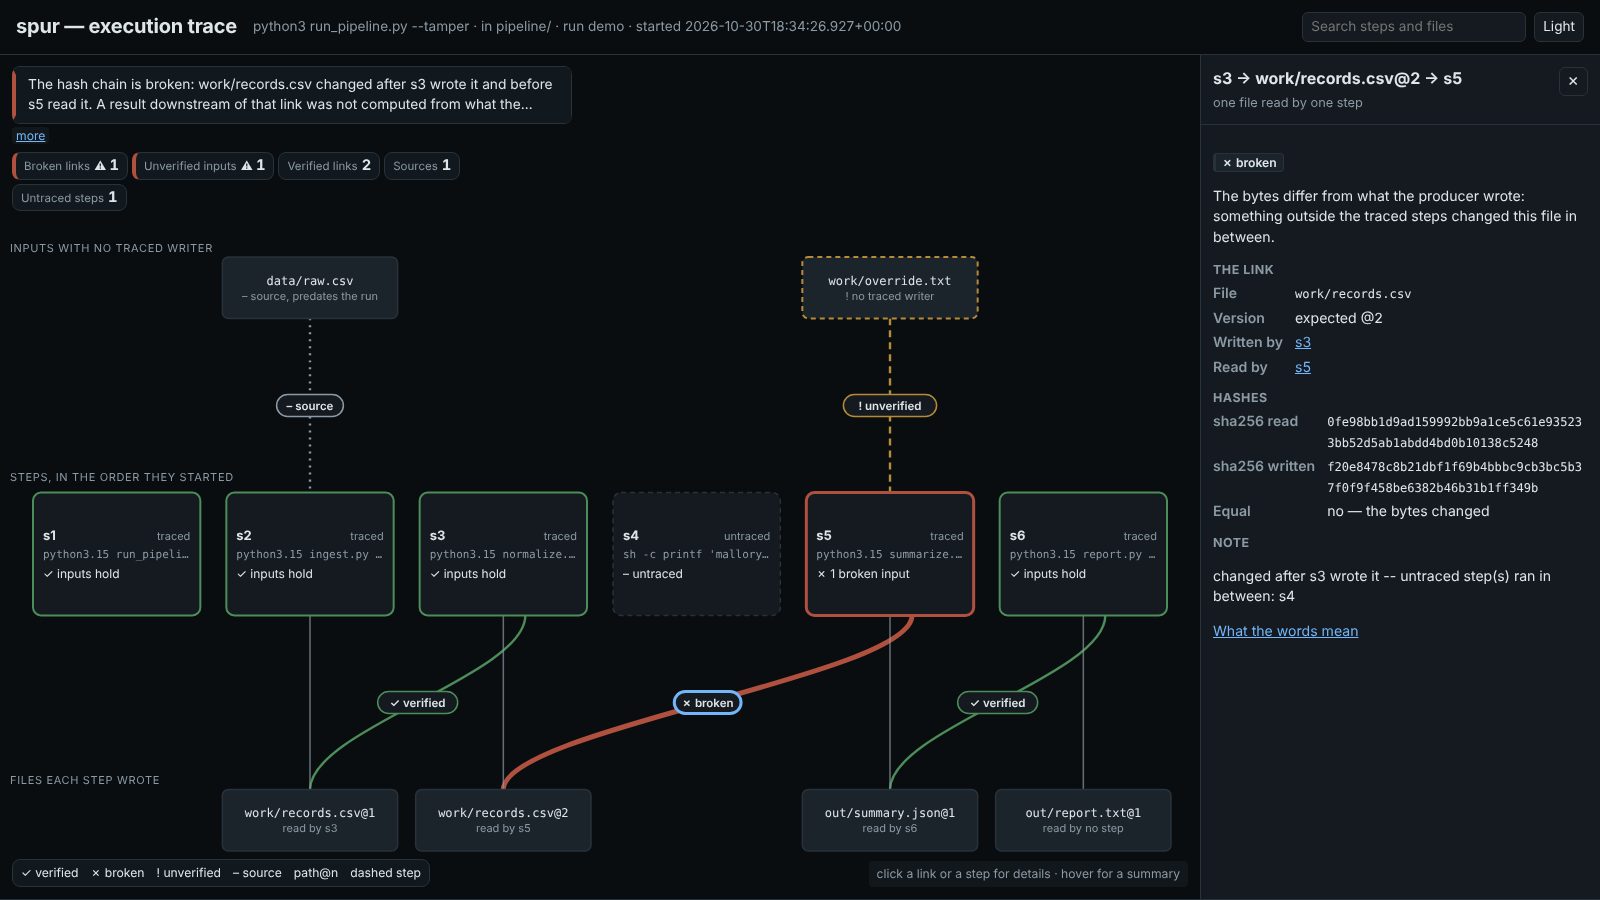
One static page per run: the step chain is the figure, with the verdict over it. Click a link for its hashes, producer and consumer, or a step for its calls and file I/O; the list of links and one card per step follow below as the reference. It loads nothing from the network (default-src 'none'). The screenshot is rendered from the committed demo, a real run:
python3 plugins/spur/scripts/build_spur_html.py --trace plugins/spur/scripts/fixtures/spur-demo.json --out spur-report.htmlOther stacks
Only Python is traced in-process. For Rust, tracing-chrome output attaches with --calls chrome:FILE; for Node, a node --cpu-prof profile with --calls cpuprofile:DIR (sampled: counts are samples, not calls). Their file I/O is declared with --reads/--writes and marked declared, not observed. Go's runtime/trace writes its own binary format, which spur cannot read: not built. What was verified for each, and how, is in references/adapters.md.
Example Prompts
Say any of these to Claude Code once the plugin is installed — they're plain-language prompts, not exact phrasing Claude has to match. Claude routes them to the skill below by intent.
Trace a pipeline for a reviewer
"a reviewer wants to know how each figure in the paper was produced — trace the pipeline and show me which step wrote what"Runs the pipeline once under the tracer and points at
spur-report.html, leading with the chain verdict and any broken or unverified input.
Check that the steps really chain
"does the summary step actually read the file the cleaning step wrote, or did something touch it in between?"Answers from the hash chain:
verified, or the broken link with the untraced step that ran between producer and consumer.
Export provenance
"give me W3C PROV for one run of make pipeline"Traces the run and hands over
prov.json, which claims only what was observed.
Verifying a change to this plugin
python3 plugins/spur/scripts/test_spur_trace.py          # acceptance test: identical outputs, chain verified, broken on tamper
python3 plugins/spur/scripts/build_spur_html.py --selftest
python3 scripts/ci/check_viewer_conformance.py
python3 plugins/nacharbeit/scripts/nacharbeit_lint.py plugins/spur --docs-root docs
Run the acceptance test under every Python from 3.12 up; below 3.12 it is a named skip, and a failure under REQUIRE_SPUR_MONITORING=1. Its sabotage check is in its docstring: make the chain treat every prior version as a match, and the tamper cases must go red while the byte-identical case stays green.